WE1S Topic Model Observatory Guide (TMO Guide), chapter 3
3. pyLDAvis
(Document created 30 May 2019. Last revised 13 June 2019.)
[Example of this topic model interface in action (requires WE1S password)]
Credits: pyLDAvis is Ben Mabey’s port to Python of the LDAvis R package by Carson Sievert and Kenny Shirley. (See the article by Sievert and Shirley introducing LDAvis.)
pyLDAvis is a general-purpose topic model visualization interface that is useful for getting an overview of a model, looking closely at topics, and looking at words associated with topics. Among the general-purpose interfaces, it stands out especially for the “relevance metric” tool that allows the user to adjust the view of words in a topic for better understanding.
The following instructions on this page focus on methods and practices that WE1S researchers find they frequently use in interpreting topic models using pyLDAvis.
(1) Getting an Overview of a Topic Model
Best practice in using pyLDAvis to get an overview of a topic model is as follows:
First examine the left panel for prominent topics and apparent clusters or outliers. Then select some specific topics and in the right panel examine their top words at the “relevance” lambda (λ) settings of 1, 0, .6 (and possibly other settings). Explanations follow:
a. The left panel in the pyLDAvis interface shows the topics in a model represented as circles, where circle size indicates the relative statistical weight of topics. Clicking on a circle, or entering a topic number in the search field at the top, selects a specific topic for examination.
The left panel is also what pyLDAviscalls an “intertopic distance map (multidimensional scaling).” Like the “scaled” view in Dfr-browser and TopicBubbles, this visualization gives a sense of the statistical nearness or farness of topics from each other.
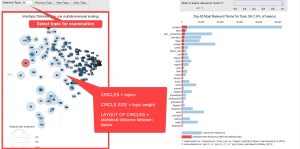
b. The right panel in the pyLDAvis interface shows the top words associated with the specific topic selected in the left panel, along with bar graphs for their weight. The blue bar for any word represents that word’s frequency in the overall topic model. The red bar represents that word’s frequency within the specific topic you have selected.
A “relevance metric” slider scale at the top of the right panel controls how the words for a topic are sorted. As defined in the article by Sievert and Shirley (the creators of LDAvis, on which pyLDAvis is based), “relevance” combines two different ways of thinking about the degree to which a word is associated with a topic:
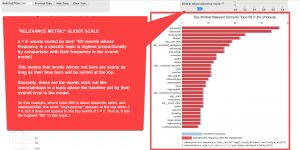
On the one hand, we can think of a word as highly associated with a topic if its frequency in that topic is high. By default the lambda (λ) value in the slider is set to “1,” which sorts words by their frequency in the topic (i.e., by the length of their red bars).
On the other hand, we can think of a word as highly associated with a topic if its “lift” is high. “Lift”–a term that Sievert and Shirley borrow from research on topic models by others–means basically how much a word’s frequency sticks out in a topic above the baseline of its overall frequency in the model (i.e., the “the ratio of a term’s probability within a topic to its marginal probability across the corpus,” or the ratio between its red bar and blue bar).
By default, pyLDAvis is set for λ = 1, which sorts words just by their frequency within the specific topic (by their red bars).
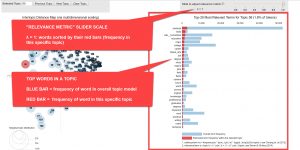
By contrast, setting λ = 0 words sorts words by their “lift. This means that words whose red bars are nearly as long as their blue bars will be sorted at the top. (In the example shown in the screenshot below, where topic #58 is about students, skills, and employability, the word “high-paying” thus appears at the top when λ = 0, but it does not appear in the top words if λ = 1. It has the highest “lift” in this topic.)
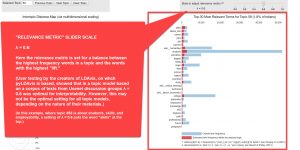
In using pyLDAvis, you should experiment with the relevance slider metric to see if particular settings balancing between λ = 1 and 0 make the top words shown in the panel more coherent and interpretable. For example, after looking at the words at both the λ = 1 and 0 settings, slide the scale to λ = 0.6. In user testing with a topic model based on the well-known “20 Newsgroups” text corpus, Sievert and Shirley found that λ = 0.6 was optimal for interpretable results. (Note: The “20 Newsgroups” corpus often used for machine-learning experiments consists of material gathered from Usenet “newsgroups.” Usenet groups were more like discussion forums than “news” in a more general sense. The text samples related to technology, sports, politics, and religion in “20 Newsgroups” may not be representative of the corpus you are topic modeling. The optimal λ setting for your topic model may thus vary.)
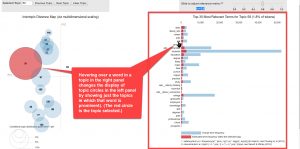
c. The left and right panels in pyLDAvis also interact in another way. When a topic is selected, hovering your mouse over a word in the right panel will change the left panel to show only the other topics in which that word is prominent.
(2) Looking Closely at Topics
a. Examine individual topics: If you have identified specific topics to examine, select them in the pyLDAvis’s left panel (or search for the topic number at the top of that panel). Then look closely at the top words of that topic in the right panel, using at least three lambda (λ) relevance metric settings: 1, 0, and .6. See if adjusting the relevance metric brings into more coherent focus what the topic is “about.” \
b. Explore laterally from a topic to other topics: Hover your mouse over some of the top words in the right panel of the topic you have examined to see in the left panel what other topics that word is prominent in. Then look closely at the top words in some of those other topics, perhaps choosing in particular the ones that seem to be “nearer” in the intertopic distance map.
(3) Looking at Words Associated with Topics
a. pyLDAvis does not provide for a way to search for a word or find it in an index (unlike Dfr-browser or TopicBubbles). However, If you spot a word you are interested in when viewing the words of a topic in pyLDAvis’s right panel, you can hover your mouse over that word to see in the left panel what other topics it is prominent in. \
b. A particularly useful tactic is to run your mouse cursor down the whole series of top words in a topic, seeing what other topics show up in the left panel. Especially worth notice might be any words that produce in the left panel just a few topic circles (meaning that the word is prominent in just a few of the model’s topics). Among the subset of words that produce in the left panel just a few topic circles, even more noteworthy by any that produce in the left panel either a very large or very small circle for the topic whose word list you are looking at relative to the circles of other topics (meaning that while the word is prominent in your currently selected topic, it is much more so or less so than in other related topics).


