WE1S Topic Model Observatory Guide (TMO Guide), chapter 5
5. Metadata7D
(Document created 9 June 2019. Last revised 15 June 2019.)
[Example of this topic model interface in action (requires WE1S password)]
Credits: Metadata7D created by WE1S (Dan Costa Baciu, Sihwa Park, Yichen Li, Junqing Sun)
Metadata7D is a specialized (but also very flexible) interface for exploring the relation between topics in a model and different parts of a corpus. For example, you can see which topics a particular publication source is associated with. You can also compare how any two topics are distributed over sources, or how any two sources are distributed over topics. Particularly powerful is the ability of Metadata7D to work with parts of the corpus grouped by metadata tags at the class-level–e.g., all Western versus Eastern U.S. newspapers, or mainstream newspapers versus student newspapers.
The parts of a corpus that can be analyzed in this way must be identified by metadata in the corpus underlying a topic model. (“Metadata” means such identifiers as “publisher,” “author,” and “date” that give information about a document. These metadata–along with certain class-level metadata about kinds, venues, and locations of sources–are prepared in advance during the collection and pre-processing of the WE1S corpus. WE1S’s class-level metadata tags are listed in this spreadsheet.)
The instructions on this page focus on methods and practices that WE1S researchers find they frequently use in interpreting topic models using Metadata7D. In particular, this page shows how to use Metadata7D to (1) study parts of a corpus (e.g., publication sources) in relation to topics, and (2) compare two topics in relation to parts of a corpus. The description of each use-case is followed by an example.
(1) Using Metadata7D to study the distribution of different publication sources over topics

a. Description
Metadata7D’s interface has two main sections: left panel (with controls) and right panel (with controls to be added soon.
a.1. Left panel
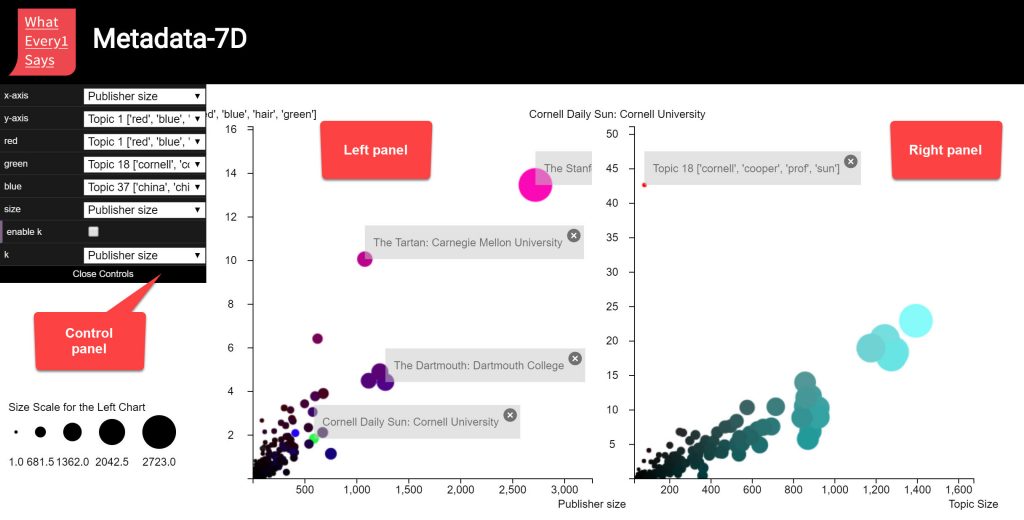
Use the controls to set up the X and Y axes of the left panel to show what publication sources are most associated with what topics. First set the X-axis control for “publisher size,” meaning that sources will be laid out in the left panel in increasing order of their frequency in the model. Then set the Y-axis to a specific topic number (in the example in the screenshot, topic 1). Topics identified by their numbers along with their top words are picked from a drop-down list.
The result in the left panel will be a visualization showing circles representing publication sources. Clicking on one or more circles will show the title of the publication source. The farther to the right on the X-axis a circle is, the more frequent the number of articles from that source in the model. The higher up on the Y-axis a circle is, the more that source is statistically related to the selected topic.
Note that often the circles will gravitate toward a diagonal line going from left to right, and low to high. The more a circle representing a source rises above the slope of that line, the more “specific” is the relation of the source to the selected topic–i.e., the more its association with the topic rises above the baseline of overall association of sources in the model with that topic. (By contrast, the farther a source descends below the diagonal slope, the less specific and close the relation of the source to the selected topic. Outlier sources well below the slope may be interesting for having a negative relation to atopic.)
The sweet spot for interpretation is likely the publications appearing in the upper-left quadrant of the graph space in the left panel.
Other fields in the controls enhance the visualization in the left panel and add information about other aspects of the model. You can do the following:
- Color the topic(s) you are most interested in: You can set the controls for “red,” “green,” and “blue” so that one color shows the particular topic you are interested in, and the other two colors show any two other topics. This will make topics show up in the left panel highlighted with their color. Blended colors indicate that the part of your corpus you are studying (e.g., publication source) is prominent across two or more of your designated topics.
- Set “size” to specific topics instead publishers. By default, “size” is set to “publisher size,” meaning that the size of circles in the graph represent the frequency of a publication source in the model. But you can also set size to a specific topic. This makes the size of the circle for a source represent the degree with which that source is related to that topic.
a.2. Right panel
Initially blank, the right panel is activated once the controls for the left panel are set and by means of interaction with the left panel. (In essence, the left panel operates the right panel and sets its controls.)
As described above, clicking on a circle(s) in the left panel will show the title of the publication source represented by that circle. Double-clicking on that title will then populate the right panel with circles representing the topics with which that publisher is associated.
- In the right panel, the X-axis represents the weight of the topic. The farther to the right a topic, the more statistical weight it has in the model.
- The Y-axis in the right panel shows the specificity of topics in relation to the publication source that you clicked in the left panel: how much a topic is prominent for a source above the baseline of that topic’s overall prominence in the model. The higher a topic appears above the normal diagonal slope of topics in the right panel, the more uniquely associated it is with a publisher.
Clicking on a circle representing a topic in the right panel will show that topic’s number and its top words. (You can click on multiple circles to show their topic numbers and top words.)
Then, at the end of your process of examining the right panel, you can use it interactively to repopulate the left panel with different information. (In essence, the right panel in turn becomes the controls for the left panel.) Clicking on the topic number and key words once they are displayed in the right panel will replace the publication sources originally shown in Metadata7D’s left panel with sources associated with whatever topic you choose in the right panel.
a.3. Best practice is to explore the relation a topic and its publication sources in the left panel, looking for sources that stand out as being especially related to a topic (rising into the upper left quadrant of the graph space). Then click on the titles of interesting sources in the left panel to study in the right panel what other topics they are associated with.
b. Example: Since Metadata7D is complicated to explain descriptively, a specific example of using the interface may help. The example is illustrated in the screenshot below:

Here we have used the control panel to do the following:
- Set the X-axis to show the prominence of publishers (sources). In the left panel of the interface, the farther to the right a publication source appears, the more prominent (frequent) it is in the model.
- Set the Y-axis to Topic 1 (keywords of this topic: “red, blue,” etc.). In the left panel, the higher a publication source appears, the more it is associated with topic 1.
- Set “red” = Topic 1. In the left panel, the more red a publication source, the more it is associated with topic 1.
- Set “green” = Topic 18 (keywords: “Cornell,” etc.). In the left panel, the more green a publication source, the more associated it is with topic 18.
- Set “blue” = Topic 37 (keywords: “china, chinese,” etc.): In the left panel, the more blue a publication source, the more it is associated with topic 37.
- Set “size’ = “Publisher size”: In the left panel, the size of the circles will now represent the frequency of the publication sources in the model. (Alternatively, we could set “size” to equal any topic, which would make the size of the circles represent the frequency of that topic in the model.)
With the controls set as described above, then the Metadata7D interface functions as follows:
- Clicking on a circle in the left panel will show the publication source name (e.g., “The Tartan”). One can click on several circles to show the names of multiple sources.
- Clicking on a publication source name will then populate the right panel with circles representing topics with which that source is associated.
- In the right panel, the X-axis represents the weight of the topic. The farther to the right a topic, the more statistical weight it has in the model.
- The Y-axis in the right panel shows the specificity of topics in relation to the publication source that you clicked in the left panel: how much a topic is prominent for a source above the baseline of that topic’s overall prominence in the model. The higher a topic appears above the normal diagonal slope of topics in the right panel, the more uniquely associated it is with a publisher..
- Clicking on a circle representing a topic in the right panel will show that topic’s number and top words.
- Clicking on the topic number and key words once they are displayed will then replace the publication sources shown in Metadata7D’s left panel with the sources associated with that topic.
(2) _Using Metadata7D to study the distribution of two topics over publication sources

a. Description
For simplicity’s sake, only the operation of the left panel of the Metadata7D interface will be explained here (only the left panel is shown in the screenshot above). The right panel functions as described above in section 1.a.2 of this chapter.
a.1. Left panel
Previously (as described in section 1.a.1 of this chapter above) we used the controls to set up the X and Y axes of the left panel to show what publication sources are most associated with what topics. But we will now use the controls of the left panel (something that can also be done in the right panel) for a different purpose: studying the distribution of two topics over publication sources.
Here we set the X-axis control for one topic number, and the Y-axis control for a second topic number.
The result in the left panel will be a visualization showing circles representing publication sources that are laid out on the X and Y axes according to their affinity with the two topics we have chosen. (As usual in Metadata7D, clicking on one or more circles will show the title of the publication source.) The farther to the right on the X-axis a circle is, the more that articles from source are associated with one topic. The higher up on the Y-axis a circle is, the more that source is statistically related to the second topic.
The other controls enhance the visualization in the left panel and add information about other aspects of the model as previously described in section 1.a.1 of this chapter.
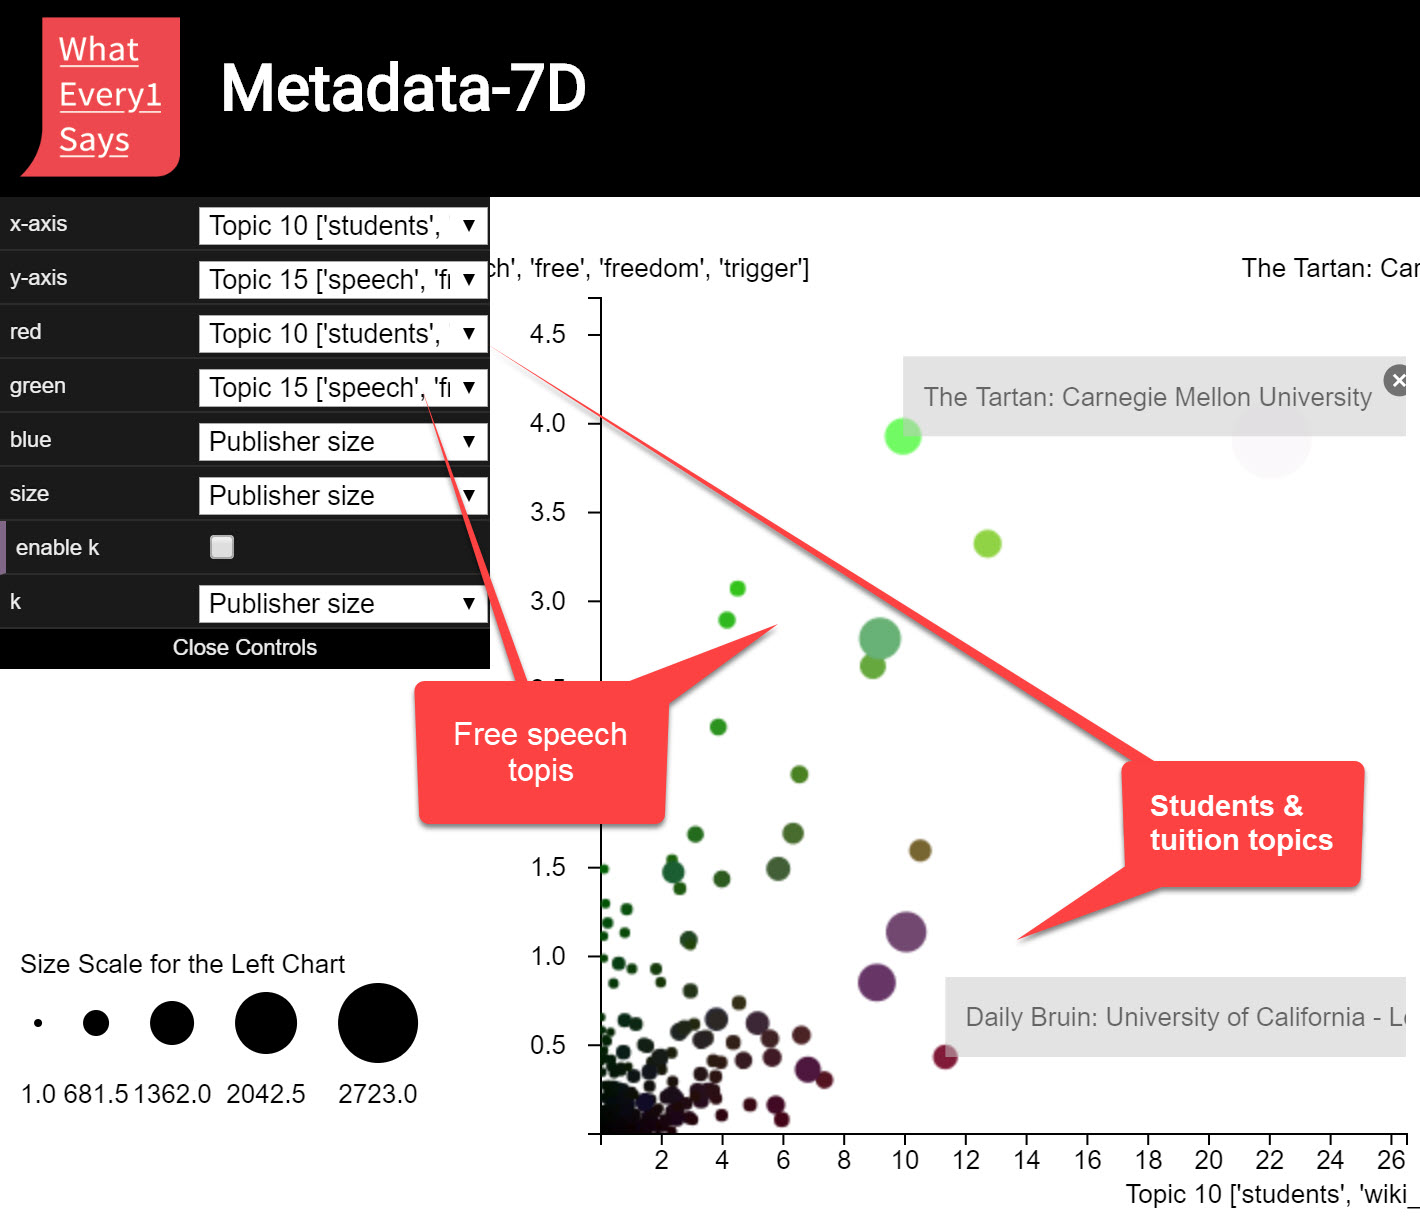
b. Example: (See screenshot of left panel above)
Here we have used the controls to do the following:
- Set the X-axis to Topic 10 (keywords: students, wiki_tuition,” etc.: In the left panel of the interface, the more a publication source is associated with this students and tuition topic, the more its circle will appear toward the right.
- Set the Y-axis to Topic 15 (keywords: “speech, free,” etc.]: In the left panel, the more a publication source is associated with this free speech topic, the more its circle will appear higher in the graph.
- Set the red and green colors to represent topics 10 and 15, respectively: this colors the publication source circles in the left panel to correspond to those topics. The more green a circle, for example, the more associated a publisher is with the free speech topic.
- The blue color is not set. (However, you can set one of the topics you are studying to both “green” and “blue” to intensify its color visibility in the graph.)
- Set ‘size” to “publisher size: this makes the size of the circles in the left panel represent the relative statistical weight of the publication sources in the model.
With the controls set as described above, then the Metadata7D interface functions as follows:
- Publication sources are separated out above or below the diagonal slope of the graph depending on whether they are more associated with topic 10 or topic 15.
- Publication sources near the diagonal slope whose colors are blended (darker green, or green purple) are associated with both topic 10 and topic 15.
- Clicking on the circles for publication sources will show the names of those sources. Double-clicking on those names will then populate Metadata7D’s right panel as usual to explore the relation of sources to topics.
(3) _Using Metadata7D to study the distribution of different “classes” of publication sources over topics
[TBD]


