WE1S Topic Model Observatory Guide (TMO Guide), chapter 2
2. TopicBubbles(Document created 27 May 2019. Last revised 22 June 2019.)
[Example of this topic model interface in action (requires WE1S password)]
Credits: TopicBubbles created by WE1S (Sihwa Park)
TopicBubbles is a general-purpose topic model visualization interface that is useful for getting an overview of a model, looking closely at topics, comparing topics, and looking at words associated with topics. Among the general-purpose interfaces, it stands out especially for facilitating the comparison of topics.
The instructions on this page focus on methods and practices that WE1S researchers find they frequently use in interpreting topic models using TopicBubbles.
(1) Getting an Overview of a Topic Model
First, explore the model in the default unscaled view:
Best practice is to start by examining top topics in the model and looking at their key words and top documents. Start with the unscaled view in TopicBubbles as follows.
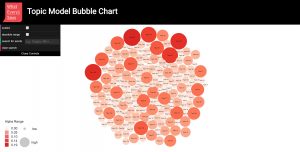
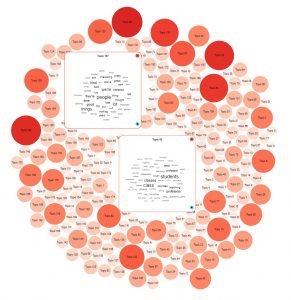
a. Default view: When you open TopicBubbles, you will see all the topics in the model represented as circles, where the size of the circles as well as their color intensity indicates relative statistical weight in the model. You can pan the view with your mouse; and you can zoom in and out by mouse-scrolling. (Note that in this view the layout of the circles is arbitrary. The circles are laid out according to a circle-packing algorithm–a way of packing different-sized circles with maximum density in an area. In essence, this view in TopicBubbles is equivalent to the “grid” overview in Dfr-browser, where the layout is also arbitrary.)
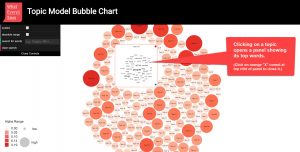
b. Top words in a topic: Clicking on a topic opens a panel showing a word cloud of the top words in that topic. (Clicking on the orange “X” button at the top right of the panel will close it.)
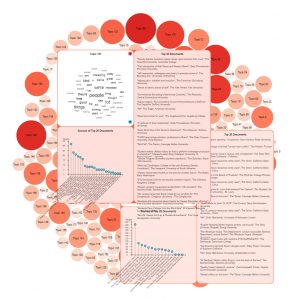
c. Other information panels: Clicking on the blue control button at the bottom right of the top-words panel then opens up two other information panels. One panel at the right shows the titles and sources of the top 20 documents associated with the topic. Clicking on a document title will open up a view of the JSON file for that article. Another panel at the bottom shows the publication sources of the top 20 documents along with a bar graph indicating the relative weight of those sources in the model. (Clicking on the blue control button again will close the additional panels. Clicking on orange “X” button at the top right of the initial panel will close all the panels.)
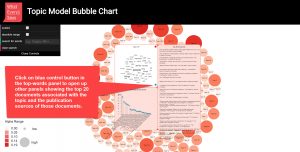
d. Seeing information on multiple topics simultaneously: One of the most useful features of TopicBubbles is that you can click on multiple topics to open information panels showing their top words, documents, and sources–thus facilitating the comparison of topics.
Next, explore the model in “scaled” view:
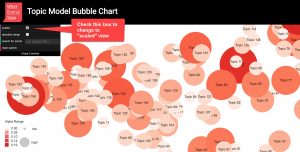
TopicBubbles has a “scaled” view (similar to that in Dfr-browser) in which the same information panels for top words, documents, and courses are available. Good practice is to use the scaled view to quickly see if there are any conspicuous clusters of topics or outlier clusters and topics.
e. Scaled view: In the controls at the top left of the TopicBubbles interface, check the box for “scaled” to transform the default layout of topics into a layout showing the same set of topic circles approximately clustered according to the “distance” (statistical similarity/difference) of topics to each other. You can zoom in and out in the view by mouse scrolling. (However, be aware that you can identify clusters more confidently by using the interfaces in the Topic Model Observatory that are specialized for that purpose: Clusters7D and DendrogramViewer).
(2) Looking Closely at Topics
TopicBubbles makes it easy to drill down into a topic for closer inspection. Choose a topic to explore and follow such steps as the following:
a. Click on the topic and open its informational panels.
b. Take a quick look at the topic’s top words, titles of top 20 documents, and publication sources of those documents.
c. Then click on the document titles among the top 20 shown to access their JSON files, which will show you additional metadata and other information about the original documents, including information about how to access them from databases or original sources. (During the development phase of the WE1S project, when topic models are restricted by password just to developers, WE1S developers using the link also have allowed, temporary access to the text of documents.)
(3) Comparing Topics
TopicBubbles is excellent for comparing two or three topics at a time as follows:
a. Click on the topics you want to examine together and open their information panels.
b. Quickly compare the topics’ top words, documents, and document sources.
c. Then drill down into the documents as needed.


(4) Examining (and Relating Words Prominent in Topics_
TopicBubbles is excellent for searching for words and seeing what topics they are prominent in.
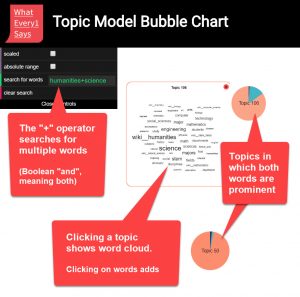
a. You can search for the word in the control box at the top left of the TopicBubbles interface. The “+” operator allows you to search for the Boolean “and” (i.e., “must include all”) of two or more words–e.g., “humanities+science”.
Alternatively, when click on a topic to open the word-cloud panel for its top words, you can click on any word you see to add it to the search function. (This is the equivalent of adding another word with the “+” operator in the control box. panel for a topic, you can click on any word to find other topics in the model where that word is prominent.
b. Searching for a word filters the topics shown in TopicBubbles just to those in which the word is prominent. In the transformed view, the topic circles are now pie graphs indicating the relative weight of the word in those topics.
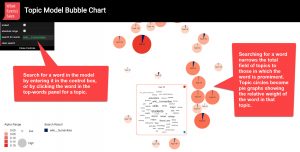
c. Searching for the Boolean “and” (“+”) of two or more words filters the topics shown in TopicBubbles just to those in which all of the words are prominent. This is an excellent way to explore the relation of words in a topic model. For example, you can use this technique to look for topics in which both “humanities” and “science” are prominent words.
