WE1S Topic Model Observatory Guide (TMO Guide), chapter 8
8. DendrogramViewer
(Document created 7 June 2019. Last revised 23 June 2019.)
[Example of this topic model interface in action (requires WE1S password)]
**Credits: **DendrogramViewer created by WE1S (Scott Kleinman).
DendrogramViewer is a specialized interface for exploring “topic-clusters” (statistically-related clusters of topics) in topic models. Along with Clusters7D (TMO Guide, Chapter 7), it is designed to help identify meaningful and robust topic-clusters.
“Meaningful” and “Robust” Topic-Clusters Defined
Intuitively, it should be possible to group together “related” topics based on whether the topics contain the same words in similar proportions. Such groupings may be termed “topic-clusters”. The easiest way to conceptualize a topic-cluster is as a group of circles, where each circle represents a topic and is plotted on the X/Y coordinates of a two-dimensional statistical space that is a simplification of the multidimensional statistical “nearness” and “farness” of topics relative to each other. Drawing a larger circle around a set of topic circles that are statistically “near” each other (and “distant” from others) groups that set of circles into a cluster.
However, there are many types of statistical algorithms that can be used to cluster topics (or any data), and the fact that these employ different rules means that they may yield different apparent topic-clusters. It is thus important to evaluate apparent topic-clusters for their meaningfulness and robustness. “Meaningful” means that topic-clusters contain topics that appear to have genuinely related meanings (rather than being topics that are thrown together as a statistical artifact of the algorithm). “Robust” means that many of the topics in topic-clusters seem to appear “near” each other regardless of which algorithm or topic modeling interface we employ.
Important methodological caution: In general, you should consider the analysis of topic-clusters to be only supplementary to understanding the main phenomena shown in topic models: the topics themselves (and the relations they show between words and documents in a corpus). Consider that topics are already a reduction of the complexity of relations between words and documents. After all, that is their point: to categorize high-dimension data (e.g., millions of possible relations) into a lower-dimension set (e.g., just 200 topics) making it easier to see patterns. This means that clusters of topics are a reduction of a reduction in complexity–a second-order reduction. They might enhance our understanding of a topic model by showing larger-scale patterns at work; but at best they can do so with less confidence. If topic-cluster analysis using one tool seems to show something important, you can increase confidence in the results by seeing if other tools show the same results. Or you can examine a lower-granularity version of your topic model (e.g., 50 topics instead of 200) to see if a cluster you think you have found shows up as one of the grosser topics in such a model.
DendrogramViewer visualizes “hierarchical clusterings” of topics in a topic model that have been prepared in advance as part of the WE1S workflow for creating topic models. Hierarchical clustering is a common method for clustering data (in this case, topics) that are statistically “near” versus far” from other data.
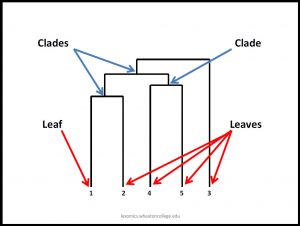
As is typical of visualizations of hierarchical clustering, DendrogramViewer shows the topics in a topic model as individual “leaves” in a branching tree diagram. Leaves statistically close to each other are organized into “clades.” As in an evolutionary tree, the lower the stem joining leaves into clades in the diagram, the closer the topics are to each other statistically. (Note that the horizontal orientation of leaves and clades–whether one lies to the left or right of another–is arbitrary.) (For a fuller explanation of dendrograms, see these resources: “Hierarchical Cluster Analysis”, “How to Read a Dendrogram”, and this video on hierarchical clustering.)
The instructions on this page focus on methods and practices that WE1S researchers find they frequently use in interpreting topic models using DendrogramViewer.
(1) Dendrogram of All Topics in a Topic Model
Dendrogram opens to a view of all the topics in a model:
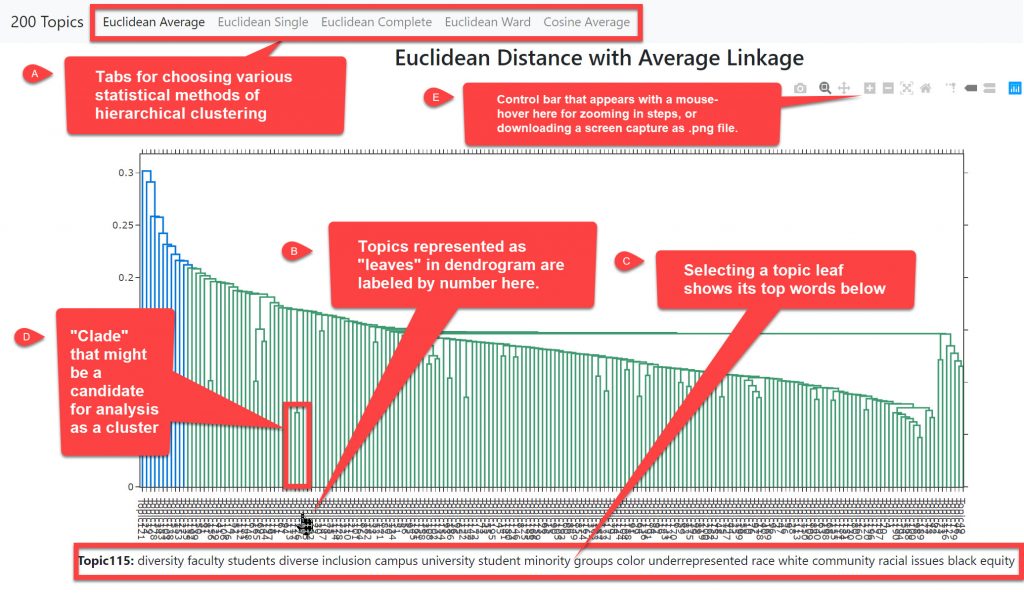
a. Statistical methods menu: At the top of the interface is a menu for choosing among available statistical methods of hierarchical clustering. Each method combines a “distance metric” with a method of “linkage.” (For an explanation, see “Hierarchical Cluster Analysis”.)
b. Topics represented as “leaves”: Topics are shown as individual “leaves,” each labeled below the diagram by their topic numbers.
c. Topic labels and key words: Hovering with the mouse over a label, or clicking on a label to fix the selection of a leaf, shows at the bottom of the interface a topic’s most prominent words.
d. “Clades”: Topic leaves are gathered by the clustering algorithm chosen in the statistical methods menu into “clades” that might be candidates for analysis as clusters.
e. Control bar: Mouse-hovering over the top right of the interface will make a control bar appear. From the control bar you can download a screen capture of the dendrogram as a .png file and also zoom in or out in steps.
(2) Zooming in on Clades in the Topic Model
DendrogramViewer allows you to zoom in on clades in the overall dendrogram for a closer look.
a. Using your mouse (keeping the left mouse button depressed), draw a box around a portion of the dendrogram–typically a clade. (You can also zoom in on the dendrogram by steps with the controls in the bar at the top right of the interface, which only appear if you mouse-hover in that area.)
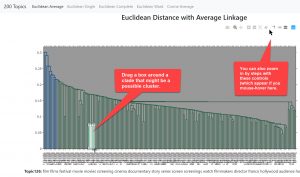
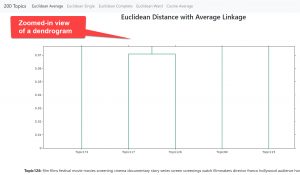
b. Once you have drawn a box around a portion of the dendrogram, releasing your mouse’s left button will instantly show a zoomed-in view of that portion. Double-clicking with your mouse anywhere in the zoomed-in view will then return you to the overall dendrogram.
(3) Best Practices for Using DendrogramViewer
a. Preliminary steps:
Choose one of DendrogramViewer’s statistical clustering methods (in the menu at the top of the interface)–e.g., “Euclidean Distance with Average Linkage.” To make working with the resulting dendrogram easier (allowing you to draw on it and make notes), print out a screenshot.
b. Observation steps:
b.1. First look for any obvious individual topics that are singleton outliers standing apart from everything else (single leaves technically known as “simplicifolious” in dendrograms). Note their topic numbers and inspect their key words. If any such outlier topics seem interesting, you should inspect them using one of the general interfaces in the Topic Model Observatory: Dfr-browser, TopicBubbles, and pyLDAvis.
b.2. Second, look for any obvious or notable apparent clusters (clades). These can include:
- Clusters that are outliers standing apart from everything else,
- Clades of topics that are closely related to each other (stem apart lower in the diagram),
- Bunches of clades (like grapes on the vine) that descend from a common stem.
On your print-out, draw boxes around areas of the dendrogram that you want to remember to look at closely.
b.3. Zoom in on clades and bunches of clades that are of interest, and look at their key words. For any candidate clusters that you think deserve even closer inspection, use one or more of the general interfaces in the Topic Model Observatory–Dfr-browser, TopicBubbles, and pyLDAvis (TMO Guide, chapters 1, 2, 3)–to examine the topics in those clusters. Take notes for yourself about such phenomena as follows:
- representative or important topics in a cluster
- the relative prominence of topics in the model
- And how “meaningful” the relation between topics in a cluster seem to be (as judged by what they appear to be about, the top words they share, and the articles associated with them).
c. Iterations of above using other statistical clustering methods:
Repeat the above steps using DendrogramViewer’s other available statistical clustering methods (in the menu at the top of the interface). Look especially for indications that the clusters you previously noticed appear to exist in some form in the dendrograms produced by different clustering methods. This would be a sign that clusters are both meaningful and “robust.”
d. Compare your results with that of using the other set of cluster analysis tools in the Topic Model Observatory (pyLDAvis.clusters.topics and pyLDAvis.clusters.words).
Use Clusters7D (TMO Guide, chapter 7) to see if you can replicate the results of your DendrogramViewer cluster analysis. Note whether DendrogramViewer and the pyLDAvis.cluster interfaces converge on any similar clusters. Such clusters visible in both sets of interfaces may give us more confidence that the clusters are really there in meaningful and robust ways.
