WE1S Topic Model Observatory Guide (TMO Guide), chapter 7
# 5. Clusters7D
(Document created 3 June 2019. Last revised 2 July 2019.)
### [Examples of this topic model interface in action: [1](http://harbor.english.ucsb.edu:10002/pyldavis/20190521_2242_UWire_Clone-3/#topic=0&lambda=1&term=) | [2](http://harbor.english.ucsb.edu:10002/pyldavis/20190517_2351_UWire_WikiNum/#topic=0&lambda=1&term=) (requires WE1S password)]
**_Credits:_** Clusters7D created WE1S ([Dan Costa Baciu](http://we1s.ucsb.edu/team/dan-costa-baciu/), [Scott Kleinman](http://scottkleinman.com/), Yichen Li, Junqing Sun). [pyLDAvis](https://pyldavis.readthedocs.io/en/latest/readme.html) is Ben Mabey’s port to Python of the [LDAvis](https://github.com/cpsievert/LDAvis) R package by Carson Sievert and Kenny Shirley.
Clusters7D (in its two variants: showing topics in clusters and words in clusters)) are adaptations of pyLDAvis made by WE1S for the special purpose of visualizing “topic-clusters” and either topics in those clusters or words prominent in those clusters. Along with DendrogramViewer (TMO Guide, Chapter 8), these interfaces are designed to help identify meaningful and robust topic-clusters.
“Meaningful” and “Robust” Topic-Clusters Defined
Intuitively, it should be possible to group together “related” topics based on whether the topics contain the same words in similar proportions. Such groupings may be termed “topic-clusters”. The easiest way to conceptualize a topic-cluster is as a group of circles, where each circle represents a topic and is plotted on the X/Y coordinates of a two-dimensional statistical space that is a simplification of the multidimensional statistical “nearness” and “farness” of topics relative to each other. Drawing a larger circle around a set of topic circles that are statistically “near” each other (and “distant” from others) groups that set of circles into a cluster.
However, there are many types of statistical algorithms that can be used to cluster topics (or any data), and the fact that these employ different rules means that they may yield different apparent topic-clusters. It is thus important to evaluate apparent topic-clusters for their meaningfulness and robustness. “Meaningful” means that topic-clusters contain topics that appear to have genuinely related meanings (rather than being topics that are thrown together as a statistical artifact of the algorithm). “Robust” means that many of the topics in topic-clusters seem to appear “near” each other regardless of which algorithm or topic modeling interface we employ.
**Important methodological caution**: In general, you should consider the analysis of topic-clusters to be only _supplementary_ to understanding the main phenomena shown in topic models: the topics themselves (and the relations they show between words and documents in a corpus). Consider that topics are already a reduction of the complexity of relations between words and documents. After all, that is their point: to categorize high-dimension data (e.g., millions of possible relations) into a lower-dimension set (e.g., just 200 topics) making it easier to see patterns. This means that clusters of topics are a _reduction of a reduction_ in complexity–a second-order reduction. They might enhance our understanding of a topic model by showing larger-scale patterns at work; but at best they can do so with less confidence. If topic-cluster analysis using one tool seems to show something important, you can increase confidence in the results by seeing if other tools show the same results. Or you can examine a lower-granularity version of your topic model (e.g., 50 topics instead of 200) to see if a cluster you think you have found shows up as one of the grosser topics in such a model.
The instructions below on this page focus just on using the special functions of Clusters7D.topics and Clusters7D.words. (For general instructions on using the pyLDAvis interface, see TMO Guide, Chapter 3.)
(1) Clusters7D.topics

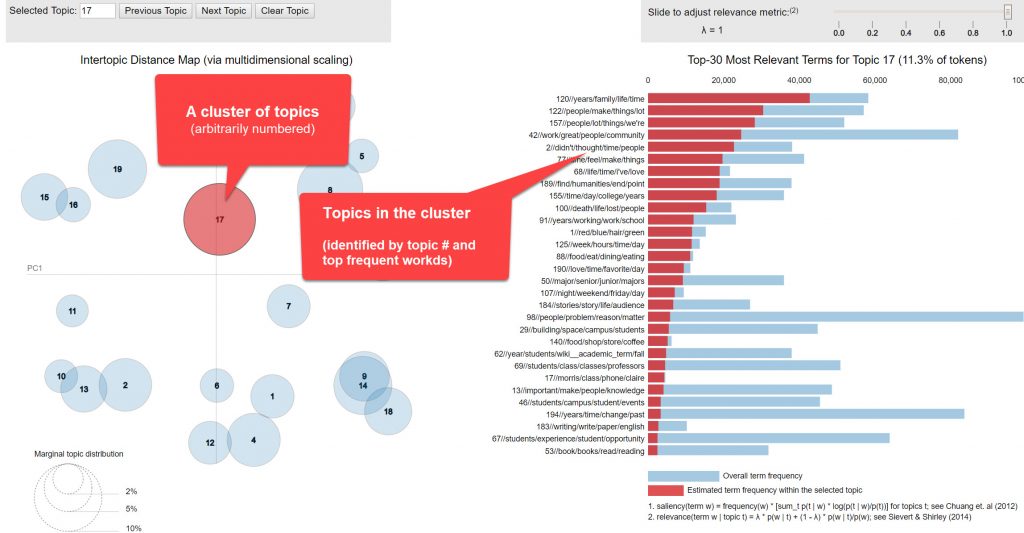
a. The left panel of Clusters7D.topics shows circles representing 20 topic-clusters in the model. These clusters are arbitrarily numbered. Selecting a topic-cluster (or searching for its number in the field at the top left of the interface) shows in the right panel the topics most prominent in that topic-cluster. (Ignore the tile label for the right panel that reads, “Top-30 most relevant terms for topic,” which is a holdover from the normal pyLDAvis interface.) Adjusting the relevance metric scale at the top of the right panel changes the sorting of these topics by “relevance” as defined in pyLDAvis–in this case, a balance between the prominence of a topic in the cluster (represented by a red bar) and the “lift” of a topic or how much its frequency sticks out in the cluster above the baseline of its overall frequency in the model (represented by a blue bar). (See TMO Guide Chapter 3, section 1.b, for a detailed explanation of the relevance metric.)
b. Best practice in using Clusters7D.topics is to follow one of the following two interpretive pathways:
b.1 Select a topic-cluster (in the left panel) and examine its top topics in the right panel at several ? relevancy metrics, including 1 (emphasizing frequency of documents in a topic), 0 (emphasizing the “lift” of documents in a topic), and values in between. (Note that the value of ? = 0.6 that Sievert and Shirley’s article suggests is optimal after user testing on a particular topic model does not necessarily apply for Clusters7D.topics, since here the relevance metric is being used on topics in relation to topic-clusters for which there has been no user testing.)
b.2 Select a topic (in the right panel) you are interested in while you have any particular topic-cluster selected, and examine in the left panel which other topic-clusters that topic is prominent in (as well as the relative proportions of such topic-clusters). Then select those other, related topic-clusters one after another and examine where the topic you are interested shows up in the relevance rankings for them. Also, note other topics the topic you are interested in keeps company with in those related topic-clusters.
c. Whichever of the above two interpretive pathways you follow, a particularly useful tactic while you have a topic-cluster selected in the left panel is to run your mouse cursor down the whole series of topics in that cluster in the right panel, seeing what other topic-clusters show up in the left panel as ones that specific topics are prominent in. Especially worth notice might be any topics that light up in the left panel just a few topic circles (meaning that the topic is prominent in just a few of the model’s clusters). And, among the subset of topics that produce in the left panel just a few topic-clusters, even more noteworthy by any topics that light up in the left panel either a very large or very small circle for the topic-cluster you initially selected (meaning that while the topic is prominent in your selected topic-cluster, it is much more so or less so than in related topic-clusters).
d. The steps above will give you a sense of what topic clusters might provide better contextual understanding of any particular topic in the model–especially if the topic clusters you see are confirmed by their appearance in another interface specialized for identifying clusters such as DendrogramViewer (TMO Guide, Chapter 8). Note whether DendrogramViewer and the pyLDAvis.cluster interfaces converge on any similar clusters. Such clusters visible in both sets of interfaces may give us more confidence that the clusters are really there in meaningful and robust ways.
(2) Clusters.words_

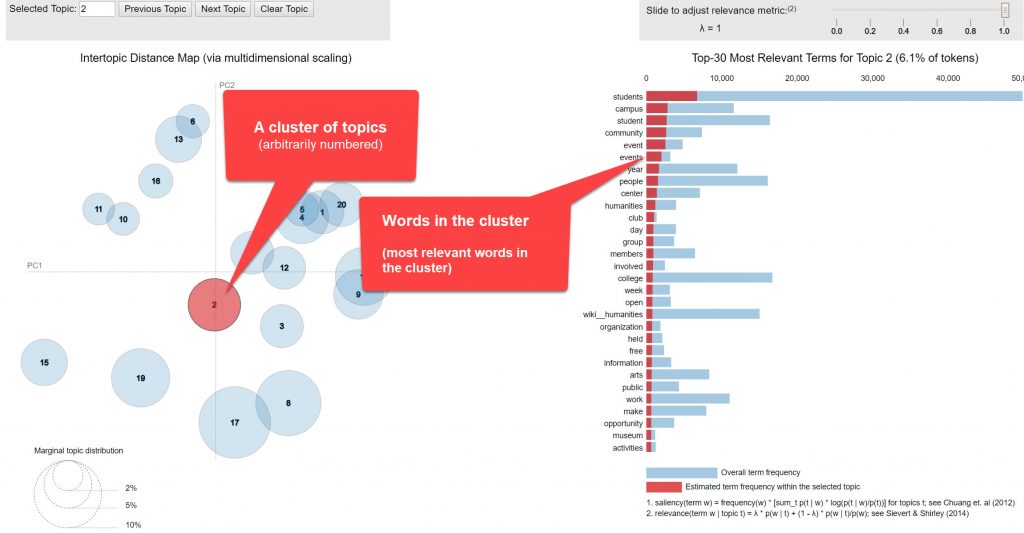
a. The left panel of Clusters7D.words shows circles representing 20 topic-clusters in the model. These clusters are arbitrarily numbered. Selecting a topic-cluster (or searching for its number in the field at the top left of the interface) shows in the right panel the words that are most prominent in that topic-cluster. (Ignore the tile label for the right panel that reads, “Top-30 most relevant terms for topic,” which is a holdover from the normal pyLDAvis interface.) Adjusting the relevance metric scale at the top of the right panel changes the sorting of these words by “relevance” as defined in pyLDAvis–in this case, a balance between the prominence of a word in the cluster (represented by a red bar) and the “lift” of a word or how much its frequency sticks out in the cluster above the baseline of that word’s overall frequency in the model (represented by a span style=”background-color: #cce6ff;”>blue bar). (See TMO Guide Chapter 3, section 1.b, for a detailed explanation of the relevance metric.)
b. Best practice in using Clusters7D.words is to follow one of the following two interpretive pathways:
b.1 Select a topic-cluster (in the left panel) and examine its top words in the right panel at several ? relevancy metrics, including 1 (emphasizing frequency of documents in a topic), 0 (emphasizing the “lift” of documents in a topic), and values in between. (Note that the value of ? = 0.6 that Sievert and Shirley’s article suggests is optimal after user testing on a particular topic model does not necessarily apply for Clusters7D.words, since here the relevance metric is being used on words in relation to topic-clusters [instead of topics] and there has been no user testing for this.)
b.2 Select a word (in the right panel) you are interested in while you have any particular topic-cluster selected, and examine in the left panel which other topic-clusters that word is prominent in (as well as the relative proportions of such topic-clusters). Then select those other, related topic-clusters one after another and examine where the word you are interested shows up in the relevance rankings for them. Also, note other topics the word you are interested in keeps company with in those related topic-clusters.
c. Whichever of the above two interpretive pathways you follow, a particularly useful tactic while you have a topic-cluster selected in the left panel is to run your mouse cursor down the whole series of words in that cluster in the right panel, seeing what other topic-clusters show up in the left panel as ones that specific words are prominent in. Especially worth notice might be any words that light upin the left panel just a few topic circles (meaning that the word is prominent in just a few of the model’s clusters). And, among the subset of words that produce in the left panel just a few topic-clusters, even more noteworthy by any words that light upin the left panel either a very large or very small circle for the topic-cluster you initially selected (meaning that while the word is prominent in your selected topic-cluster, it is much more so or less so than in related topic-clusters).
d. The steps above will give you a sense of what topic clusters might provide better contextual understanding of any particular word in the model–especially if the topic clusters you see are confirmed by their appearance in another interface specialized for identifying clusters such as DendrogramViewer (TMO Guide, Chapter 8). Note whether DendrogramViewer and the Clusters7D interfaces converge on any similar clusters. Such clusters visible in both sets of interfaces may give us more confidence that the clusters are really there in meaningful and robust ways.


