WE1S Topic Model Observatory Guide (TMO Guide), chapter 6
6. GeoD
(Document created 9 June 2019. Last revised 15 June 2019.)
[Example of this topic model interface in action (requires WE1S password)]
Credits: GeoD created by WE1S (Dan Costa Baciu, Cindy (Xindi Kang), Yichen Li, Junqing Sun)
GeoD visualizes geographical information (locations and entities with geocoded information) contained in topic models. It can be used to analyze locations discussed in the whole corpus underlying a whole model or in a specific topic.
The geocoded information that MetadataGeoD maps is gathered from the corpus for a topic model first through a “wikification” process (using the Illinois Wikifier; see L. Ratinov et al., 2011) that confirms the recognition of named entities by checking for correspondence to locations, organizations, etc., for which there are articles in Wikipedia, and secondly through collecting latitude/longitude information for the data. (However, not all possible named entities can be recognized and geocoded as locations in this way.)
(1) Using GeoD

a. Description
GeoD’s interface has four main components:
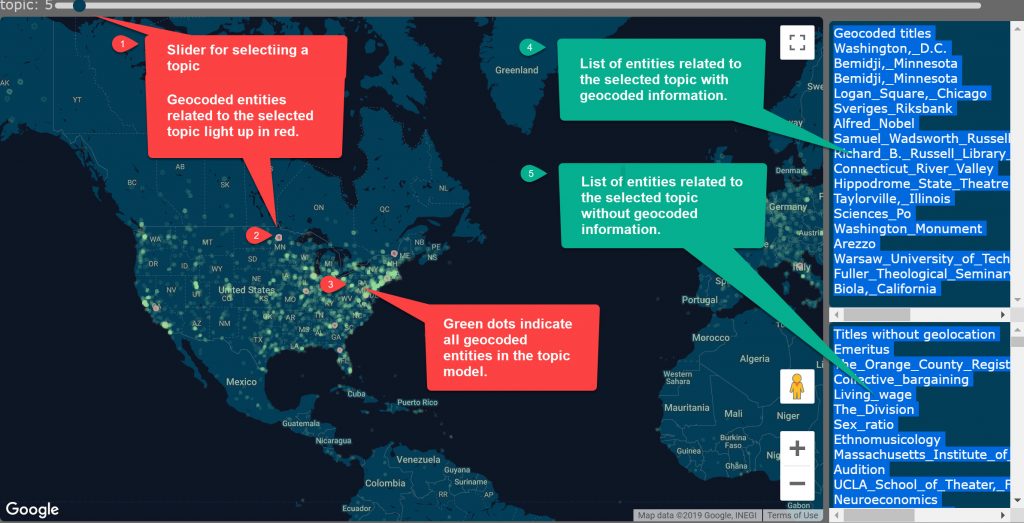
a.1. Topic slider bar. A topic slider bar at the top of the interface (#1 in the above screenshot) allows you to select a topic for analysis.
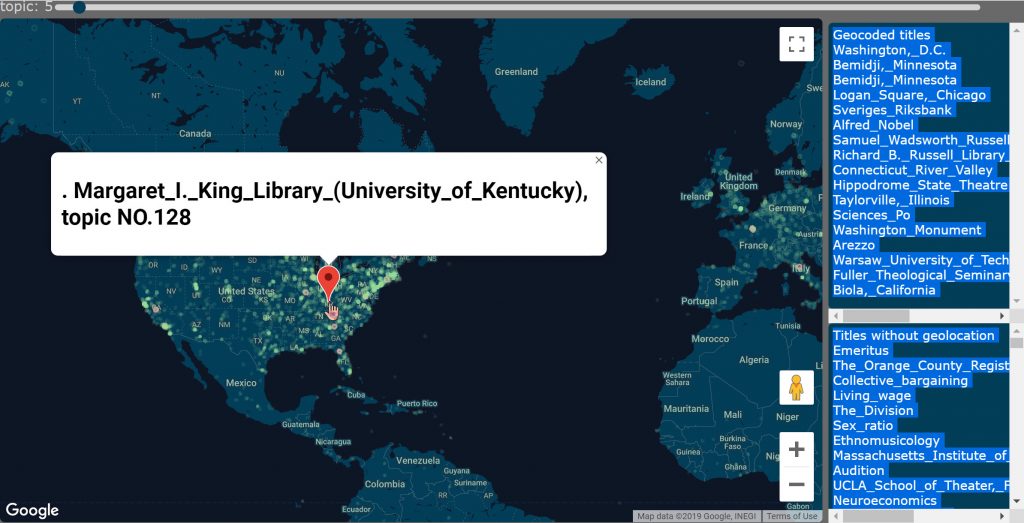
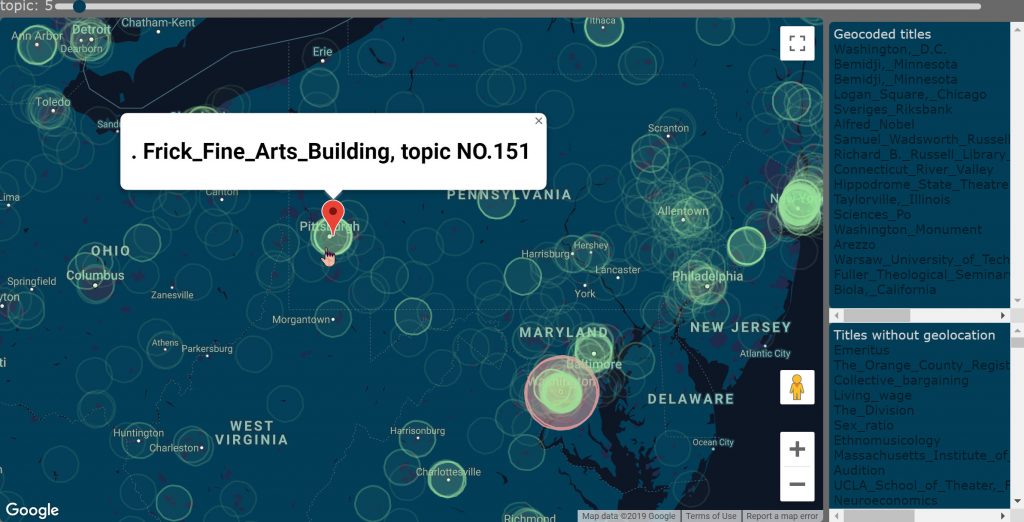
a.2. Map. The main panel in the interface shows a navigable and zoomable Google map of the world with lit-up nodes (circles in a zoomed-in view) representing geocoded locations or entities. Red nodes (for example, #2 in the screenshot) are locations or entities related to the specific topic that has been selected using the topic slider bar. Green nodes (#3 in the screenshot) are locations or entities that are mentioned in the corpus of the topic model as a whole. Mouse-hovering over a node (red or green) will show its location or entity name together with the topic related to it.
a.3. List of geocoded locations and entities (#4 in screenshot). The upper right panel of the interface shows a list of the locations and entities related to the currently selected topic for which the model has geocoded information.
a43. List of non-geocoded entities (#4 in screenshot). The lower right panel shows a list of possible locations and entities related to the currently selected topic for which the model does not have geocoded information. (Some of these will clearly not be locations or geolocated entities.)
b. Best Practice
b.1. Get an overview of what the world looks like from the point of view of the corpus of the topic model. Use the topic slider bar to sample topics in a model, getting an overview of the density distribution of geocoded locations and entities in the model (the green dots that light up on the world map for each topic).

b.2. Zoom in to explore regions. You can zoom in to study particular areas of the map, hovering with your mouse to show the names of geocoded locations and entities and the topics associated with them.

b.3. Study particular topics and their associated geocoded locations and entities. Choose one or more topics that you want to study in detail and examine the geolocations with which they are associated (lit up in red). Hover over the red nodes to see the names of those locations and entities. Also scroll through the list of geocoded entities in the upper-right panel (as well as the entities without geocoded information in the lower-right panel).
b.4. Best practice is to use GeoD in conjunction with other interfaces in the WE1S Topic Model Observatory to gain a better understanding of the overall model and specific topics. For example, if you are using interfaces such as Metadata7D (TMO Guide, Chapter 5) to analyze the correspondence between publication sources and topics in a model, you might also want to know if particular sets of sources (e.g., West coast ones) discussion particular areas of the world more than other sets of sources (e.g., East coast ones). Or if you are using any interface to study a topic or cluster of topics for their keywords, you might also want to use GeoD to examine the geocoded entities in particular among the keywords.


