WE1S Topic Model Observatory Guide (TMO Guide), chapter 1
1. Dfr-browser
(This document created 26 May 2019. Last revised 13 June 2019.)
[Example of this topic model interface in action (requires WE1S password)]
Credits: Original Dfr-browser created by Andrew Goldstone. Adapted in minor ways by WE1S (including making text elements of the interface available for Hypothes.is annotation and display of publicly-available documents within the interface)
Dfr-browser is a general-purpose topic model visualization interface that is useful for getting an overview of a model, looking closely at a model, looking at articles associated with topics, and looking at words associated with topics.
Andrew Goldstone, the creator of the original Dfr-browser, has published excellent instructions on using the interface as a complement to a topic model he produced for the Signs journal. Sections of his instructions include: “Reading the Interview” and “Exploring in Depth.” He also has instructions on his GitHub site for Dfr-browser.
The following instructions on this page focus on methods and practices that WE1S researchers find they frequently use in interpreting topic models using Dfr-browser.
(1) Getting an Overview of a Topic Model (“Overview” tabs)
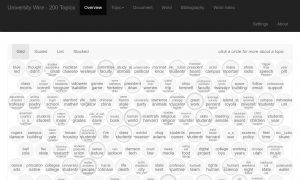
a. Under the “Overview” tab at the top of the Dfr-browser interface, start with the “grid” view, which shows all the topics in a model as regularly aligned and spaced grid of circles (each showing the top most frequent words in a topic). Mouse-hovering over a circle will show the topic number (e.g., “Topic 58”). This view of the model also represents the relative proportional weights of topics by means of the thickness of each circle’s bounding outline (though this is hard to see). Good practice is to quickly look over the topics to see if any (as suggested by their top few words or relative weight) jump out as especially worth closer examination.
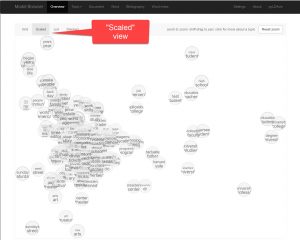
b. Next under the “Overview” tab, go to the “scaled” view, which shows the same set of topic circles approximately clustered according to the “distance” (statistical similarity/difference) of topics to each other. You can zoom in and out in the view by mouse scrolling. Good practice is to quickly see if there are any conspicuous outlier topics or apparent clusters of topics. (However, be aware that you can identify clusters more confidently by using the interfaces in the Topic Model Observatory that are specialized for that purpose: Clusters7D, and DendrogramViewer).
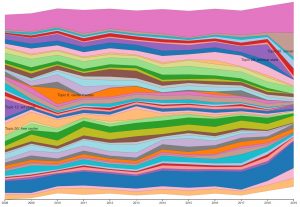
c. Then under the “Overview” tab, go to the “stacked” view to see how each top trends over time. This is a relatively hard view to use in meaningful ways for two reasons. One is that it relies on chronological metadata (when documents in the underlying corpus of a topic model were published) that may be missing or is not very granular. (WE1S has metadata for many, but not all, publication dates at the granular level of years but not of months or days.) Secondly, the only significant visual data in the “stacked” view is the relative thickness of a band representing a topic at any particular time. It can be hard to zoom in and see anything but the most obvious thickness differences. (Be careful not to be distracted by whether a topic band seems to be trending visually “up” or “down” at any time. That is purely an artifact of the layout of the bands in the visualization and has no meaning.)
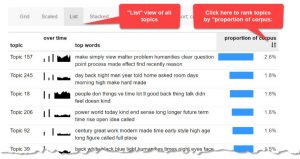
d. Finally, as a prelude to closer examination of a topic model, it is good practice under the “Overview” tab to go to the “list” view. This will show a list of the topics with more information about the most frequent words and proportional weights of each topic. By default, this list is ordered by topic number from topic #1 onward (the topic numbers are arbitrary in a model). You can sort on the “proportion of corpus” column to list the topics instead by their relative weight in the model.
(2) Looking Closely at a Topic Model (“Topic View”)
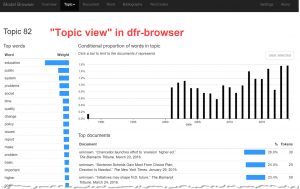
a. Examine individual topics: In any overview of a topic model, clicking on a specific topic will open it up in a detailed page for that topic (which will here be called the “topic view”). At the left are the most frequent “top words” in the topic, listed by relative statistical weight. At the top is a bar graph showing the relative weight of the topic over time (in year intervals in WE1S topic models). The bulk of the rest of the page shows the titles of top articles associated with the topic, listed by the relative statistical strength of that topic in an article. (Clicking on a bar in the time bar graph at the top of the page will select just articles for that year.) Good practice is to look over the top words and top article titles to get a better sense of the topic.
b. Explore laterally from a topic to other topics: Clicking on a word in the “top words” list will jump to a view showing what other topics the word figures prominently in (and the relative importance of the word in those topics among other words). Clicking on an article title will jump to a view showing what other topics that article is prominently associated with and the strength of the statistical associations of those topics with the article.
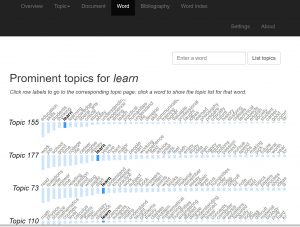
It is good practice to explore laterally to get a better sense of the near connections between topics, words, and articles. This complements the use of such views as the “scaled” overview in Dfr-browser to to gain a sense of clusters and other relationships.
(3) Looking at Articles Associated with Topics (“Article View”)
a. As mentioned above, clicking on any article title while in Topic View will lead to a detail page for the article (here called “Article View”) showing what other topics that article is associated with. Near the top left of the screen is a link labeled “view JSON.” In the original Dfr-browser, which was designed for topic models of articles from JSTOR, the equivalent link was labeled “view in JSTOR” and led to the full text of the article in JSTOR. In WE1S topic models, the “view JSON” link leads to a view of the metadata and other information about the original article, including information about how to access the article from databases or original sources. (During the development phase of the WE1S project, when topic models are restricted by password just to developers, WE1S developers using the link also have allowed, temporary access to the text of the articles.)
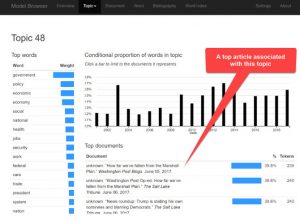
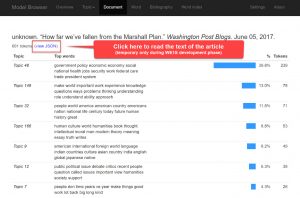
b. Good practice is to look at some of the top articles related to a topic.
(4) Looking at Words Associated with Topics (Word Index)**
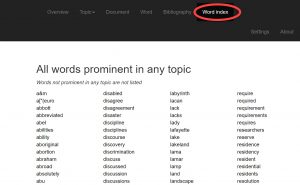
a. Clicking on the “Word index” tab at the top of the Dfr-browser interface will pull up a list of all words in topics in the model. Clicking on a word will then show the topics in whcih the word figures prominently.
(5) Bibliography View
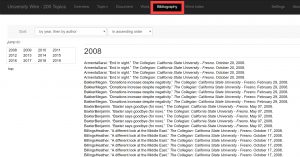
a. Clicking on the “Bibliography” tab at the top of the Dfr-browser interface will show a list of all documents that the current topic model is based on (with metadata where it exists in the corpus for author, title, source, and date).
(6) Annotating Dfr-browser using Hypothes.is
a. WE1S has tweaked Dfr-browser to allow textual elements in the interface to be annotated using the W3C standards-conformant Hypothes.is tool, which allows for private, shared, or public adding of highlights and annotations on web pages. (Set up a Hypothes.is account for yourself; install its browser extension; activate the extension when you want to annotate; select a text element in Dfr-browser; and annotate.)
