WE1S Topic Model Observatory Guide (TMO Guide), chapter 9
9. Diagnostics
(This document created 17 June 2021. Last revised 17 June 2021.)
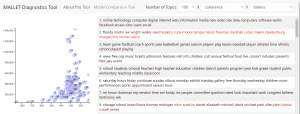
[Example of this topic model interface in action]
Credits: Original diagnostics visualization on the MALLET website. Adapted in minor ways by WE1S to allow multiple models to be shown or compared using the navigation menu.
Diagnostics is a specialized interface for assessing the quality of topic models. Based on the diagnostics visualization on the MALLET website, Diagnostics can help identify meaningful and robust topics.
Topic models are sensitive to a number of parameters, particularly the number of topics the user chooses to generate. They are also sensitive to peculiarities of the data supplied, such as variability in the length of texts and the occurrence of concentrations of rare words in some texts. As a result, different models produced from the same texts can be more or less useful for human interpretation. Some topics may consist of “junk” (numbers, abbreviations, or typographical errors), or less meaningful content such as overlay generic words. Models and topics of this nature are considered less interpretable and therefore less useful for understanding the texts from which they are generated. Many attempts have been made to identify statistical methods for identifying “quality” models and topics. MALLET produces a “diagnostics” file in XML format, which compiles many statistical metrics that can be useful in assessing the quality of models and topics, and for identifying significant and aberrant patterns in them. WE1S has adapted MALLET’s diagnostic visualization tool to make examining MALLET’s diagnostic data easier.

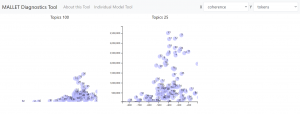
There is no “right” way to assess the quality of topics in a model. The diagnostics tool documentation (click “About this Tool” in the menu) reproduces MALLET’s explanation of the different metrics that can be applied to the statistical data in the diagnostics XML file and what they are like to say about the nature of the topics generated by the dataset. Users are encouraged to try out several metrics to see if they yield insights into how the model has generated topics. Clicking on “Model Comparison Tool” will allow the user to display visualizations for multiple models on the same page. Note that it may take a few seconds to load. If a model does not load, try refreshing the screen in your browser.

The following instructions on this page provide an overview of the functions in the visualization. Explantions for evaluation criteria given on the MALLET website are reproduced here in shortened form. Please see the original page for full explanations with mathematical definitions. One thing not stated in the discussion there is that in the keywords table, word color is scaled from black to red. Redder words have higher negative word coherence, indicating that they are words that don’t tend to co-occur often with the other terms in the topic. These terms are frequently named entities. All the explanations below refer toMALLET’s sample diagnostics file from a model trained on Wikipedia articles and an interactive interface that displays data from that file.
The following metrics are defined at the level of topics.
tokens. This metric measures the number of word tokens currently assigned to the topic. Comparing this number to the sum of the token counts for all topics will give you the proportion of the corpus assigned to the topic. If you are using optimized hyperparameters this number will vary considerably across topics; otherwise it will be roughly the same for all topics. We usually find topics most interesting if they are not on the extremes of this range. Small numbers (relative
to other topics) are often a sign that a topic may not be reliable: we don’t have enough observations to get a good sense of the topic’s word distribution. Large numbers may also be bad: extremely frequent topics are often “not-quite-stopwords”. For example, in the sample model the largest topic
is “time number term part system form”.
document entropy. We usually think of the probability of a topic given a document. For this metric we calculate the probability of documents given a topic. We count the frequency of a topic over all documents, and normalize to get a distribution, then calculate the entropy of that distribution. A topic with low entropy (ie high predictability) will be concentrated in a few documents, while a topic with higher entropy will be spread evenly over many documents. In the example topic model, the topics “list links history external information site” and “game team league player players football games” have roughly the same number of tokens, but the “list” topic has much higher entropy. It occurs to a small degree in many documents, while the “game” topic occurs a lot in a smaller number of documents. Low entropy isn’t necessarily good: it can indicate unusual documents (did you accidentally import the Mac .DS_Store file?) or the presence of documents in other languages.
word length. The average length, in characters, of the displayed top words. Words are not weighted by probablity or rank position. This is a useful proxy for topic specificity. Longer words often carry more specific meaning, so if the topic brings together lots of short words, it’s probably not a very specific topic. This can also be a good way to pick up the “hey, looks like we’ve got some Spanish!” topic because we often pick up the short words that would be stopwords if we were modeling a corpus in that language. The example topic “de french la france spanish spain italian paris el le” has a number of this type of short words, but they seem to be due to Wikipedia articles talking about French, Spanish, and Italian things rather than actual text in those languages.
coherence. This metric measures whether the words in a topic tend to co-occur together. We add up a score for each distinct pair of top ranked words. The score is the log of the probability that a document containing at least one instance of the higher-ranked word also contains at least one instance of the lower-ranked word.
To avoid log zero errors we add the “beta” topic-word smoothing parameter specified when you calculate diagnostics. Since these scores are log probabilities they are negative. Large negative values indicate words that don’t co-occur often; values closer to zero indicate that words tend to co-occur more often. The least coherent topic in the sample file is “polish poland danish denmark sweden swedish na norway norwegian sk red iceland bj baltic copenhagen cave greenland krak gda faroese”. This topic seems to be about Northern and Eastern European countries, but the short abbreviations “na” and “sk” and the words “red” and “cave” don’t really fit.
uniform_dist. We want topics to be specific. This metric measures the distance from a topic’s distribution over words to a uniform distribution. We calculate distance using Kullback-Leibler divergence.
Larger values indicate more specificity.
corpus_dist. This metric measures how far a topic is from the overall distribution of words in the corpus — essentially what you would get if you “trained” a model with one topic. We calculate distance using Kullback-Leibler divergence. A greater distance means the topic is more distinct; a smaller distanace means that the topic is more similar to the corpus distribution. Not surprisingly, it correlates with number of tokens since a topic that makes up a large proportion of the tokens in the corpus is likely to be more similar to the overall corpus distribution. The closest topic to the corpus distribution is “time number term part system form”.
effective number of words. This metric is equivalent to the effective number of parties metric in Political Science. For each word we calculate the inverse of the squared probability of the word in the topic, and then add those numbers up. Larger numbers indicate more specificity. It is similar to distance from the uniform distribution, but produces a value that may be more interpretable.
token/document discrepancy. This metric looks for “bursty” words within topics. We compare two distributions over words using Jensen-Shannon distance. The first distribution is the usual topic-word distribution proportional to the number of tokens of type w that are assigned to the topic. The second distribution is proportional to the number of documents that contain at least one token of type w that is assigned to the topic. A words that occurs many times in only a few documents may appear prominently in the sorted list of words, but may not be a good representative word for the topic. This metric compares the number of times a word occurs in a topic (measured in tokens) and the number of documents the word occurs in as that topic (instances of the word assigned to other topics are not counted). The highest ranked topic in this metric is the “polish poland danish denmark sweden swedish na norway norwegian sk red” topic, suggesting that those ill-fitting words may be isolated in a few documents. Although this metric has the same goal as coherence, the two don’t appear to correlate well: bursty words aren’t necessarily unrelated to the topic, they’re just unusually frequent in certain contexts.
rank 1 documents. Some topics are specific, while others aren’t really “topics” but language that comes up because we are writing in a certain context. Academic writing will talk about “paper abstract data”, and a Wikipedia article will talk about “list links history”. The difference is often measurable in terms of burstiness. A content-ful topic will occur in relatively few documents, but when it does, it will produce a lot of tokens. A “background” topic will occur in many documents and have a high overall token count, but never produce many tokens in any single document. This metric counts the frequency at which a given topic is the single most frequent topic in a document. Specific topics like “music album band song” or “cell cells disease dna blood treatment” are the “rank 1” topic in many documents. High token-count topics often have few rank-1 documents. This metric is often useful as a way to identify corpus-specific stopwords. But rarer topics can also have few rank-1 documents: “day year calendar days years month” is a representative example — topics for days of the week and units of measurement often appear in documents as a distinct discourse, but they are rarely the focus of a document.
allocation count. This metric has a similar motivation to the rank-1-docs metric. For each document we can calculate the percentage of that document assigned to a given topic. We can then observe how often that percentage is above a certain threshold, by default 30%.
allocation ratio. This metric reports the ratio of allocation counts at two different thresholds, by default 50% and 2%.
exclusivity. This metric measures the extent to which the top words for this topic are do not appear as top words in other topics — i.e., the extent to which its top words are ‘exclusive.’ The value is the average, over each top word, of the probability of that word in the topic divided by the sum of the probabilities of that word in all topics. Of the top words in the topic, how often to they occur in other topics? Exclusivity correlates (negatively) with token count, but also indicates vaguer, more general topics. “black hand back body cross man” is about the same size as “isbn book press published work books”, but is much less exclusive.
For those metrics that are decomposable into word-specific terms we report the values for each individual word.


